
Mobile App Development Statistics 2026: Market Growth, Revenue & Industry Trends
The mobile app industry continues to expand, but its growth tells a more complex story than rising downloads. According to Sensor Tower's State of Mobile 2026 report, global mobile app downloads reached nearly 150 billion in 2025, while consumer spending on paid applications and in-app purchases climbed to $167 billion.
The difference in growth is especially revealing. Downloads increased by 0.8% year over year, while consumer spending grew 10.6%. At the same time, consumers spent approximately 5.3 trillion hours using mobile applications, highlighting engagement across the measured ecosystem.
Beyond downloads and revenue, the industry is changing through AI-powered applications, subscription monetization, development frameworks, and differences between Android and iOS. These trends are best understood together with retention, user behavior, and development activity rather than through one headline figure.
This Mobile App Development Statistics 2026 report draws on published findings from Sensor Tower, RevenueCat, Statcounter, Apple, and market research publishers. It covers global market growth, downloads, revenue, development costs, platforms, AI applications, and forecasts. Historical results, partial-year observations, and projections are distinguished, with original sources identified throughout.
How Large Is the Global Mobile App Market?
The size of the mobile app market depends on what the research publisher includes.
Some studies examine mobile app development activity. Others measure revenue generated by applications, app-store transactions, advertising, or commerce facilitated by mobile platforms.
Treating all these activities as one market produces misleading comparisons.
Mobile App Development Market Size
Market Research Future estimates the mobile app development market at $116.87 billion in 2025, compared with $94.4 billion in 2024.
Its report forecasts a market value of approximately $988.5 billion by 2035.
Source: Market Research Future, Mobile App Development Market.
Allied Market Research provides another estimate. It values the mobile app development market at $195.7 billion in 2023 and projects $606.1 billion by 2032.
Its market description includes activities related to designing, developing, testing and deploying mobile applications.
Source: Allied Market Research, Mobile App Development Market.
The figures are not directly comparable.
They relate to different base years and proprietary methodologies. The public summaries also do not demonstrate that both publishers account for all industry activities in exactly the same way.
Therefore, averaging their figures would not produce a credible estimate of the global development market.
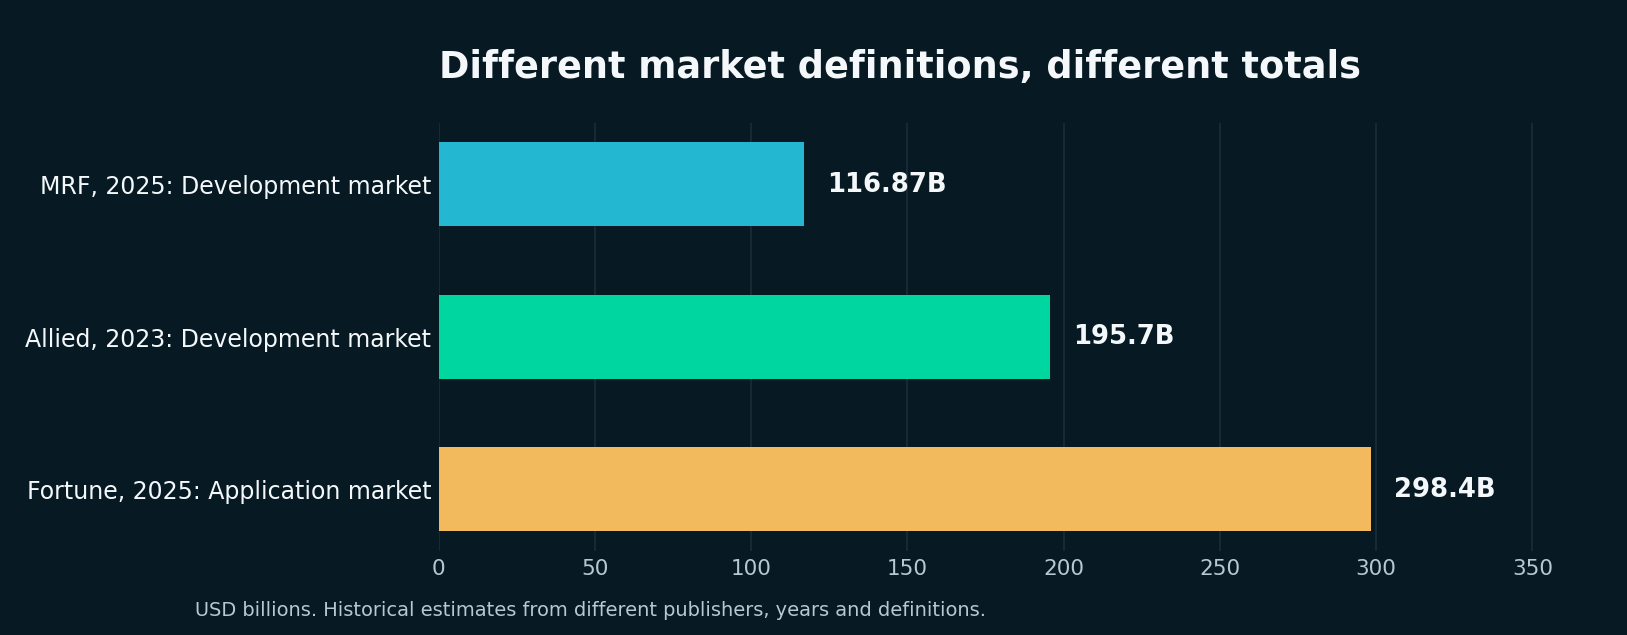
Figure 2. Selected market valuations are not a single comparable time series. No values are added or averaged.
The Broader Mobile Application Market
Fortune Business Insights reports a broader mobile application market valued at $298.40 billion in 2025.
It projects growth to $330.02 billion in 2026 and approximately $1.017 trillion by 2034, using its own market segmentation and forecast methodology.
Source: Fortune Business Insights, Mobile Application Market.
This study measures the mobile application market, not simply the fees earned by companies developing mobile applications for clients.
It should therefore be described separately from development-services estimates.
Why Do Mobile App Market Size Estimates Differ So Much?
There are five major reasons.
First, the markets are defined differently. A study of mobile app development activity does not necessarily measure the same economic activity as app-store consumer spending.
Second, the reporting years differ. A 2023 historical estimate and a 2026 forecast should not be interpreted as two observations from one consistent series.
Third, publishers use different segment boundaries. Their definitions may cover different platforms, applications, revenue categories and geographic markets.
Fourth, market forecasts involve assumptions. These can include expected demand, adoption, monetization and economic conditions.
Fifth, methodology visibility differs. Public summaries do not always disclose every assumption behind a commercial forecast.
A report can be useful without pretending these differences have been fully reconciled.
For researchers, the correct approach is to identify the publisher, market definition, reference year and evidence type next to each valuation.
Why App Store Ecosystem Sales Are Different From App Revenue
Apple's June 2026 research announcement provides a particularly useful example.
It reports that the global App Store ecosystem facilitated over $1.4 trillion in developer billings and sales during 2025.
The study identifies approximately:
Activity | 2025 value |
|---|---|
Physical goods and services | $1.1 trillion |
Digital goods and services | $149 billion |
In-app advertising | $151 billion |
Total facilitated ecosystem billings and sales | Over $1.4 trillion |
Source: Apple, App Store Ecosystem Research, June 2026.
Physical commerce includes transactions such as retail purchases, grocery orders and travel services facilitated through applications.
Those transactions should not be described as revenue earned by mobile app developers or as direct app-store digital sales.
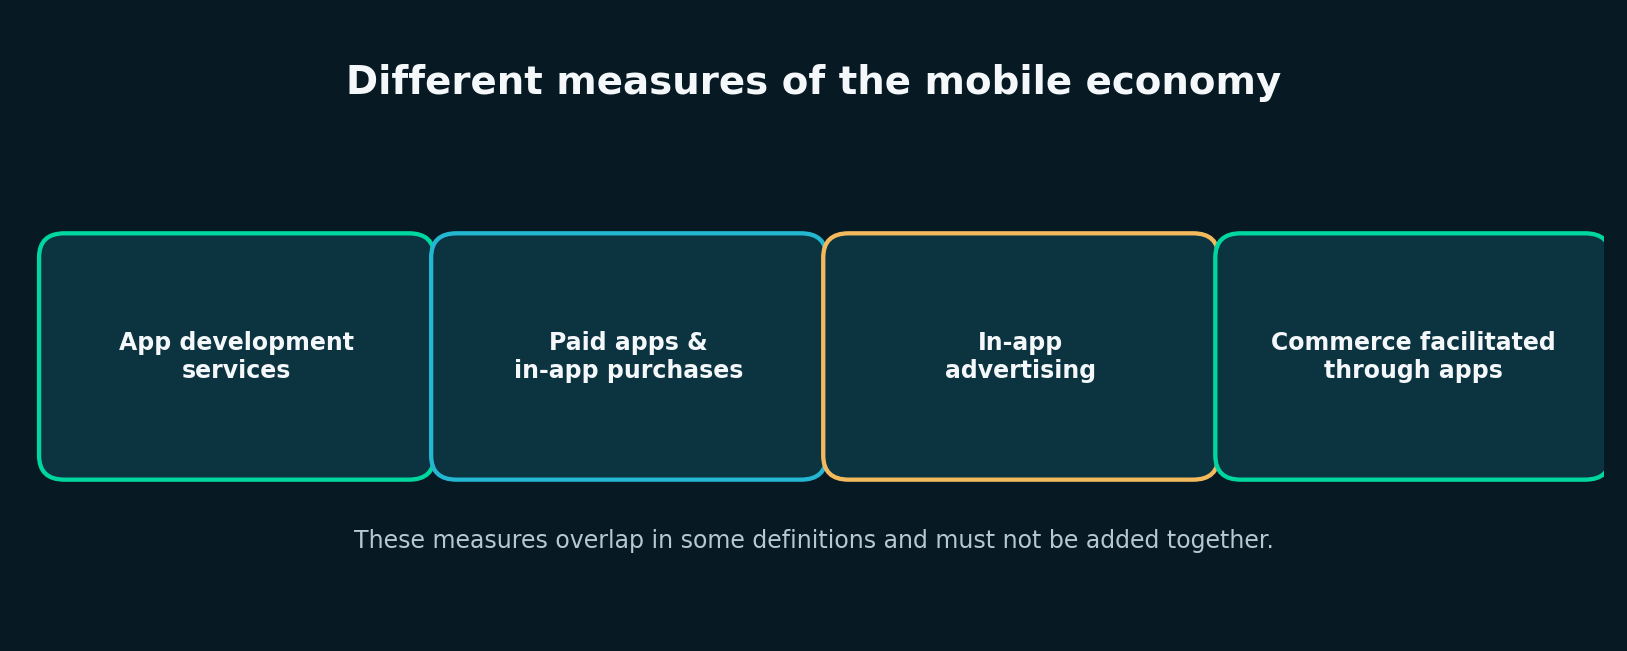
Figure 3. Conceptual distinction between development services, app spending, advertising, and app-facilitated commerce.
Research takeaway: Market size, app spending, advertising revenue and ecosystem transactions are different measures. The source definition matters more than the size of the headline figure.
Mobile App Downloads, Usage and Engagement Statistics
Global Mobile App Downloads
Sensor Tower estimates that global downloads across iOS and Google Play reached nearly 150 billion in 2025, increasing 0.8% from the previous year.
The number indicates significant ongoing demand for mobile applications, even though growth in new downloads is relatively modest.
A download is not the same as a new customer.
An application may generate repeated downloads, reinstallation activity or installations that never lead to meaningful engagement.
Businesses should avoid treating download totals as evidence of long-term product success.
Mobile App Usage Statistics
Sensor Tower estimates consumers spent 5.3 trillion hours using mobile applications in 2025, an increase of 3.8% year over year.
The report also estimates approximately 3.6 hours of daily mobile app usage per mobile user within its measurement framework.
This reflects substantial engagement, but time spent should be interpreted in context.
Long sessions may be desirable for streaming or entertainment products. For banking and business utilities, shorter sessions can indicate efficient task completion.
Downloads Versus Usage Versus Revenue
These are three different dimensions of mobile app performance.
Metric | What it measures | What it cannot establish alone |
|---|---|---|
Downloads | Install events | Active or paying users |
Usage time | Time spent in applications | Customer satisfaction or profitability |
Consumer spending | Paid app and in-app purchase activity | Total mobile economic activity |
Retention | Continued use or subscription status over time | Profitability without cost information |
The practical lesson is that acquisition, engagement and monetization must be measured together.
A mobile product with strong download numbers can still struggle if users do not return.
Conversely, a smaller application with a well-defined audience may perform successfully with modest installation volumes.
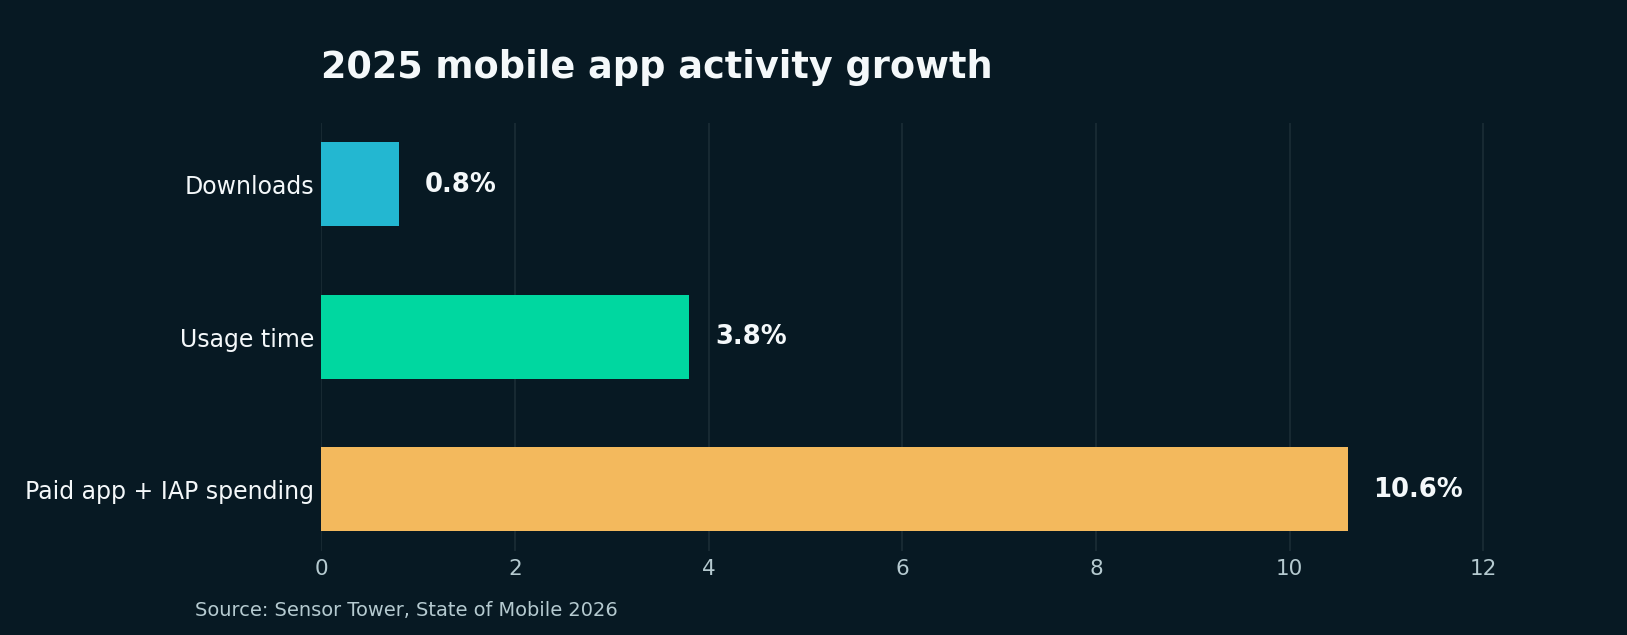
Figure 1. Year-over-year growth in measured mobile app downloads, usage time, and consumer spending in 2025.
Android vs iOS Mobile App Statistics
Global Platform Distribution
Statcounter reports the following mobile operating-system shares for September 2026:
Operating system | Measured mobile web activity share |
|---|---|
Android | 69.17% |
iOS | 30.81% |
Other | Approximately 0.02% |
Source: Statcounter Global Stats.
These values reflect tracked web page views by operating system. They do not directly measure smartphone ownership, active app installations, or unique users.
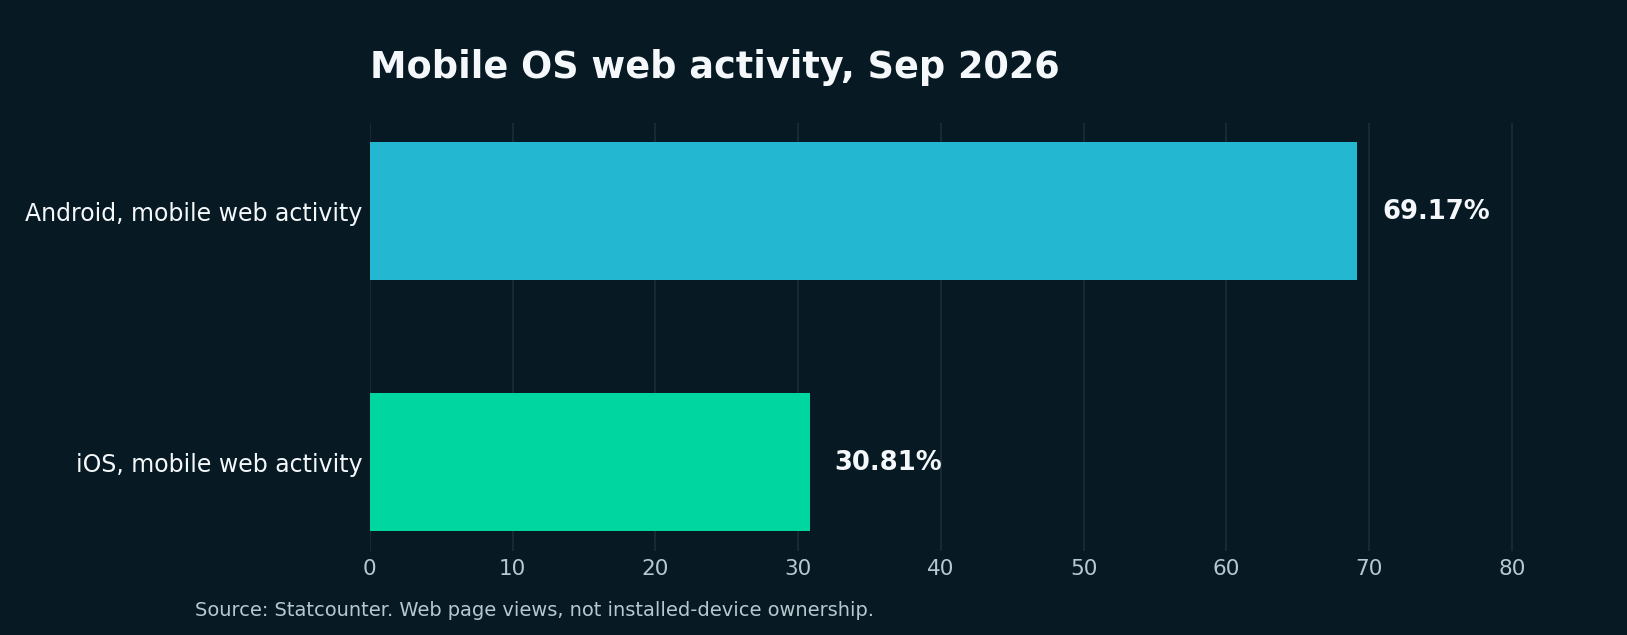
Figure 4. Statcounter September 2026 web activity shares. Not a census of installed smartphones.
For international app development, the data provides useful context but should not replace target-country research.
Which Platform Monetizes Better?
RevenueCat's 2026 State of Subscription Apps report analyzes more than 115,000 applications using its subscription management platform, representing over $16 billion in revenue.
Its platform benchmarks include:
Metric | Apple App Store | Google Play |
|---|---|---|
Median download-to-paid conversion by day 35 | 2.9% | 2.6% |
Median trial-to-paid conversion | 32.6% | 32.5% |
Day-60 revenue per install | $0.42 | $0.23 |
Year-one realized lifetime value per payer | $23.38 | $21.62 |
Source: RevenueCat, State of Subscription Apps 2026.
The App Store shows stronger median early monetization on certain measures.
However, the difference between platform medians is much smaller once users enter a trial, and year-one payer value is relatively close.
This does not mean that every iOS app will earn more than an equivalent Android app.
App category, pricing, target audience, geography and acquisition strategy matter.
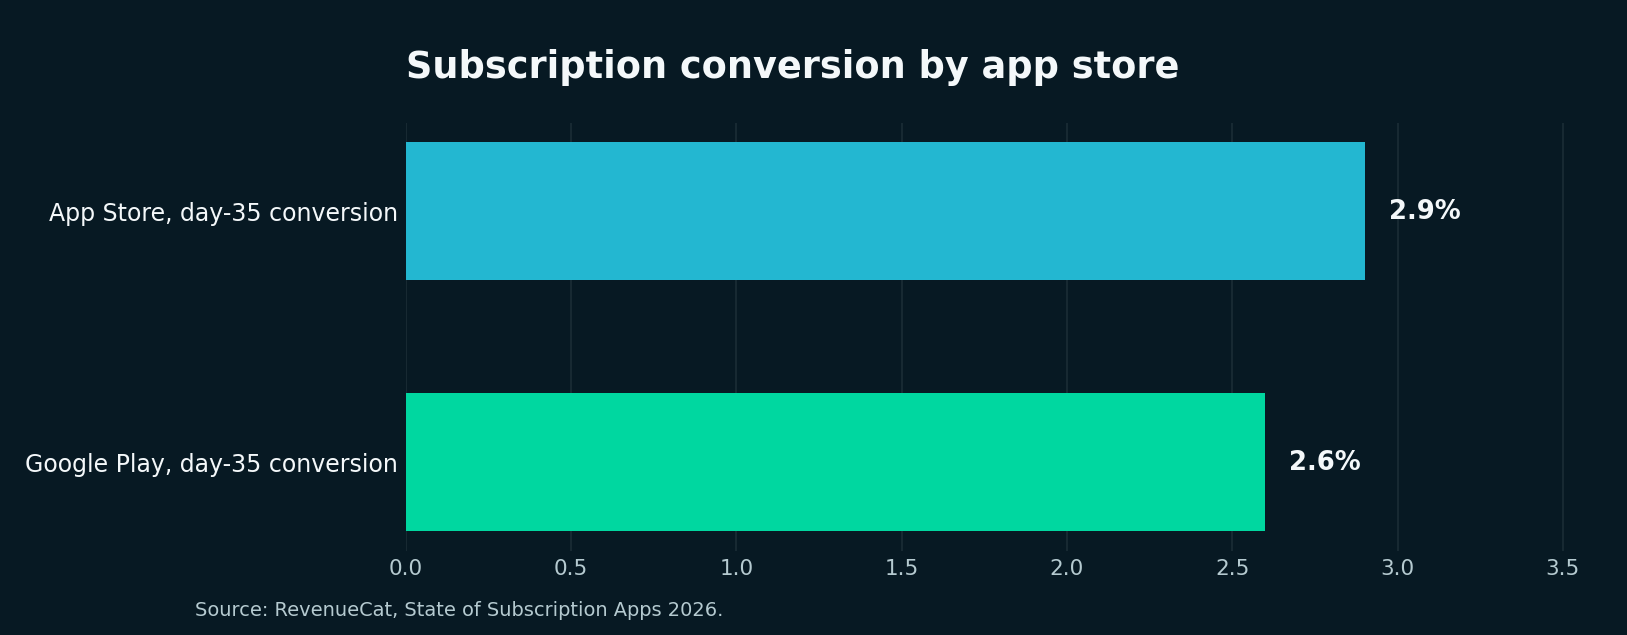
Figure 5. Median download-to-paid conversion for RevenueCat-measured subscription apps.
How Businesses Should Choose a Platform
A company deciding between Android, iOS and a dual-platform release should evaluate:
- Where its target customers actually use mobile devices.
- Whether monetization relies on subscriptions, advertising or business transactions.
- Which device features and operating-system capabilities are required.
- Development team capabilities and ongoing maintenance requirements.
- Whether users expect the product across both platforms.
Global market share alone is not sufficient to make that decision.
Mobile App Development Costs and Budget Considerations
There is no universal cost to develop a mobile application.
Development requirements vary significantly based on platform coverage, functionality, integrations, security, design, testing and support.
Publishing one industry-wide price range without a consistent project definition can mislead buyers.
How Mobile App Development Costs Are Calculated
A practical budgeting model begins with project scope and estimated work effort.
The following is a hypothetical calculation, not a surveyed industry benchmark or a Toadster project quote.
Component | Illustrative assumption |
|---|---|
Delivery effort | 1,200 hours |
Blended hourly rate | $50 |
Base delivery cost | $60,000 |
Contingency | 15% |
Initial build budget | $69,000 |
Monthly support and operations | $1,000 |
First-year support and operations | $12,000 |
Build plus 12 months after launch | $81,000 |
The calculation is:
Initial build = 1,200 × $50 × 1.15 = $69,000
Build plus 12 months after launch = $69,000 + (12 × $1,000) = $81,000
These values are examples selected to demonstrate the calculation. They are not observed market prices.
The twelve operating months are assumed to begin after launch, not necessarily at project kickoff. The model excludes separately priced marketing, customer acquisition, payment-processing charges, taxes and requirements outside the assumed project scope.
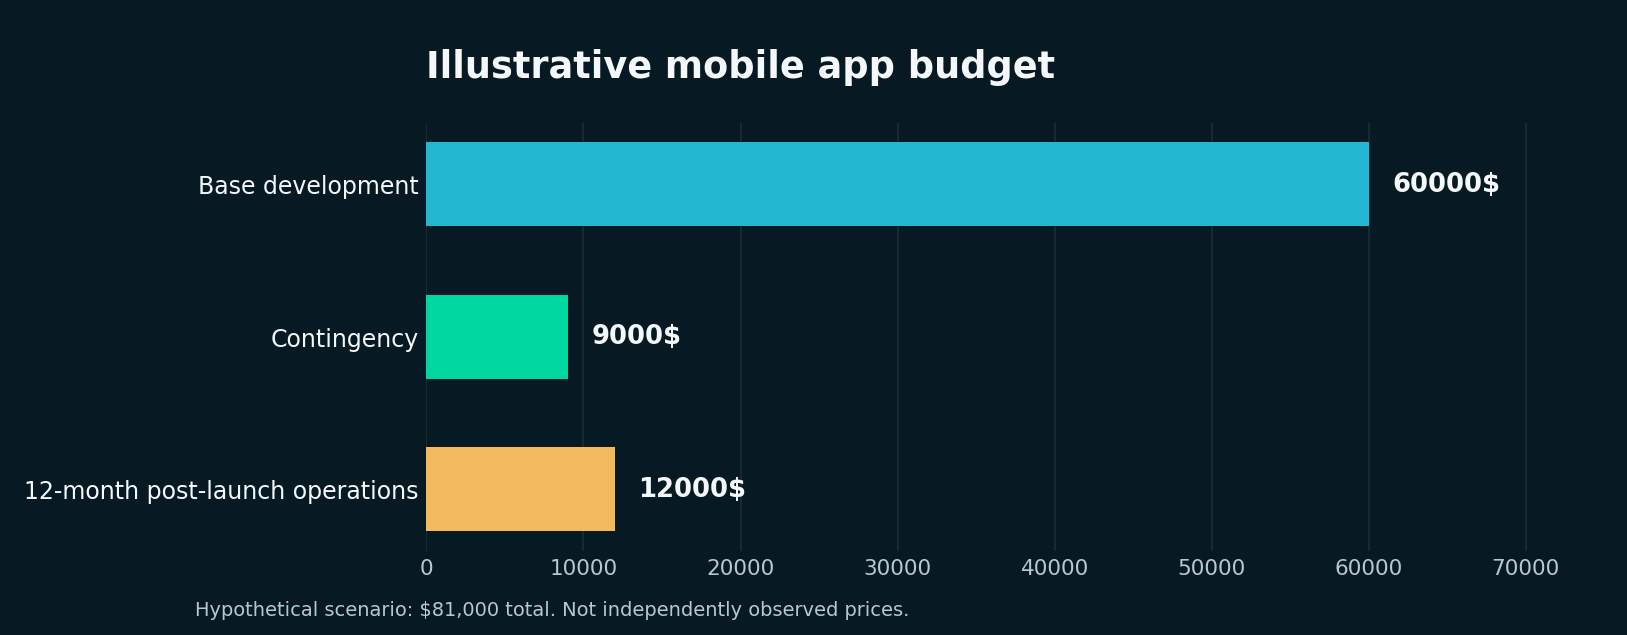
Figure 6. Hypothetical build plus 12 months of post-launch operations, not a market benchmark.
What Makes Development Budgets Increase?
Several characteristics can materially affect the total:
Multiple platforms: Supporting both Android and iOS can add testing, device-specific work and release management.
Integrations: Payments, third-party APIs, enterprise systems, identity management and legacy services can increase implementation complexity.
Security and compliance: Applications handling sensitive information may require additional architecture, testing and operational controls.
Custom interfaces: Complex interactions, accessibility requirements and device-specific experiences add design and QA work.
Ongoing operations: Maintenance, infrastructure, monitoring, bug fixes and operating-system compatibility continue after launch.
First-Year Cost Versus Initial Build Cost
A mobile app budget should distinguish at least three categories:
- One-time design and development.
- Recurring hosting, maintenance, support and monitoring.
- Business expenses such as acquisition, sales, analytics subscriptions and payment processing.
Combining these into one undocumented price estimate makes budgeting less useful.
Businesses should also specify which expenses are included in any external development quote.
Mobile App Revenue, Subscriptions and Retention Statistics
Subscription Conversion Benchmarks
RevenueCat reports median download-to-paid conversion by day 35 of:
- 2.9% on the App Store.
- 2.6% on Google Play.
It also reports 10.7% median download-to-paid conversion for applications using a hard paywall, compared with 2.1% for freemium applications.
These differences are descriptive comparisons across applications using different business models.
They do not prove that switching an existing product to a hard paywall will produce the same improvement.
Freemium products may depend on network effects, free user engagement and longer customer evaluation periods.
Subscription Retention Benchmarks
Retention measures must be interpreted according to billing frequency and cohort definitions.
RevenueCat's report gives the following median year-one subscription retention figures:
Subscription duration | Median year-one retention |
|---|---|
Weekly | Approximately 1% |
Monthly | 8% |
Annual | 28% |
These are paid subscription retention measures, not general app-user retention rates.
The report also indicates that median annual subscription retention declined from 31% in its prior comparison period to 28%.
This shows why comparing first-purchase conversion without examining renewals can produce an incomplete picture.
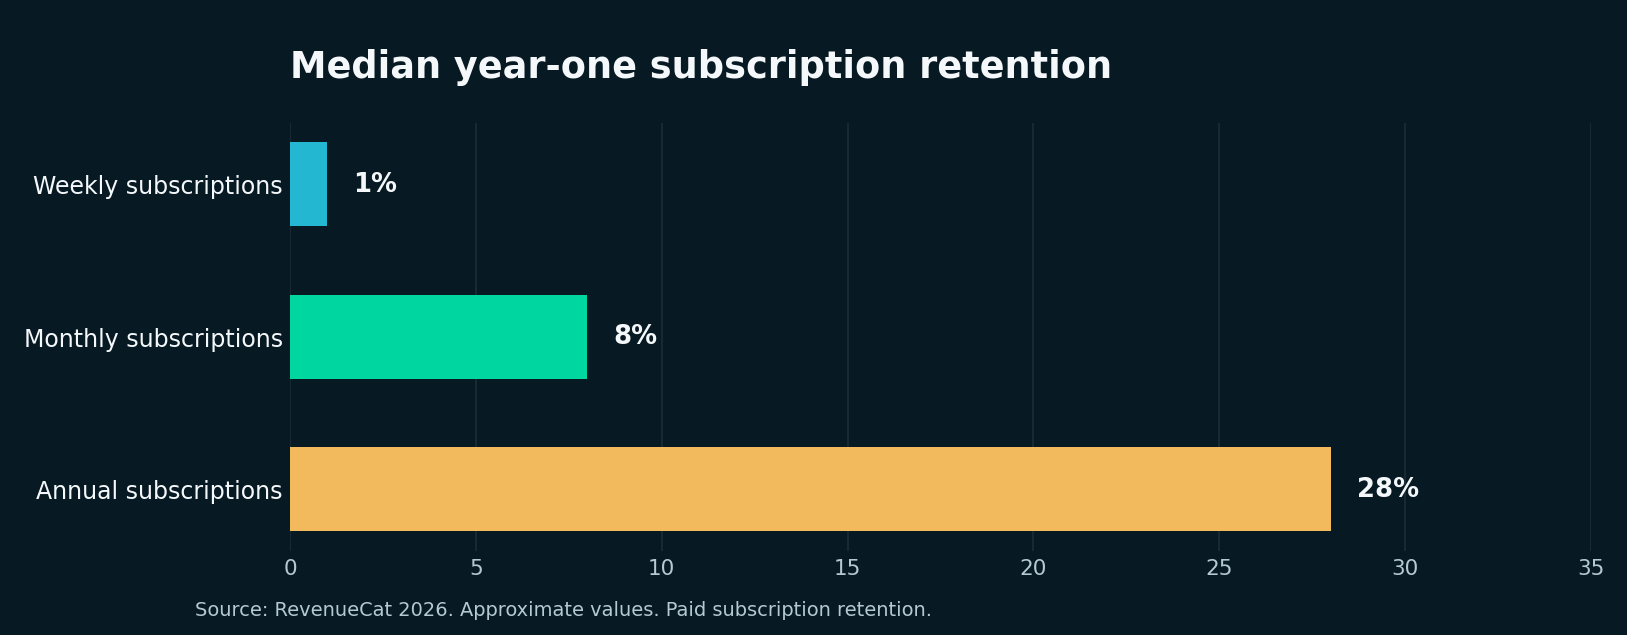
Figure 7. Approximate median year-one retention by subscription duration, not general app-user retention.
Why Monetization and Retention Should Be Analyzed Together
A company can generate strong initial sales and still struggle with customer lifetime value.
Consider two applications:
One converts many new users but loses most subscribers early.
The other converts fewer users but retains subscribers over longer periods.
The second could deliver more durable recurring revenue, depending on acquisition expenses and subscription value.
Therefore, development and product teams need to examine the full subscription journey: onboarding, payment, billing recovery, renewal, cancellation and return usage.
AI and Mobile App Development Statistics
AI-powered applications represent an important category of mobile product innovation.
However, the data also suggests that monetization and long-term user loyalty are not moving at the same rate.
AI-Powered Applications: Monetization Versus Churn
RevenueCat reports that AI-powered subscription applications in its dataset achieved approximately 41% greater year-one realized lifetime value per payer than non-AI applications.
The report gives median values of:
Metric | AI-powered apps | Non-AI apps |
|---|---|---|
Year-one realized lifetime value per payer | $30.16 | $21.37 |
Median monthly-plan 12-month retention | 6.1% | 9.5% |
Median annual-plan 12-month retention | 21.1% | 30.7% |
Median refund rate | 4.2% | 3.5% |
Source: RevenueCat, State of Subscription Apps 2026.
These results suggest higher monetization potential but weaker subscriber persistence in the measured AI application group.
The report also summarizes AI-app churn as approximately 30% faster than that of non-AI apps.
The figures should not be generalized to every app containing an AI feature.
Nor do they prove that adding AI causes higher revenue or poorer retention.
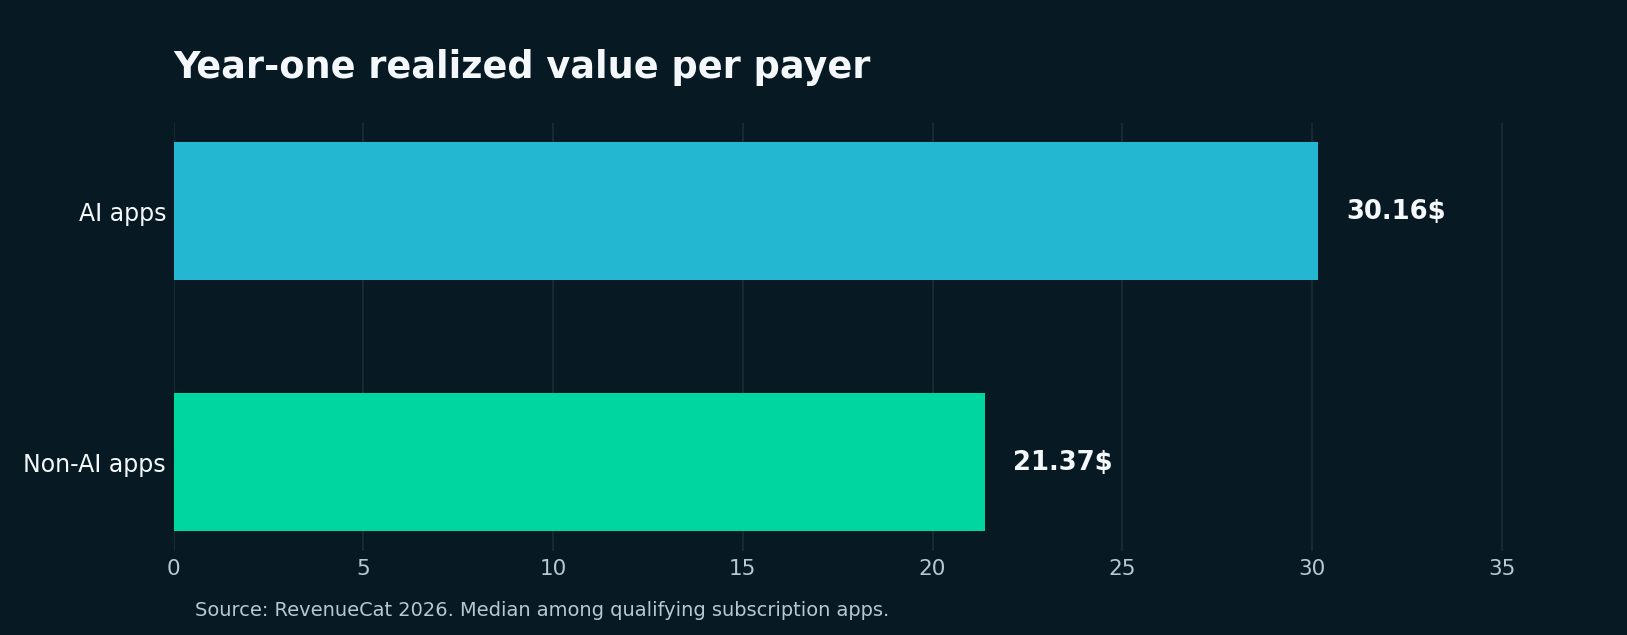
Figure 8. Median realized value per payer. Higher revenue does not imply higher net profit.
What This Means for Development Teams
AI functionality should serve a recurring customer need rather than exist solely as a novelty.
Teams should assess:
- Whether the AI feature completes a useful task.
- How users evaluate its output quality.
- Whether inference expenses are sustainable.
- How private or sensitive data is handled.
- Whether the feature improves repeat use.
- How failures and human escalation are managed.
The monetization data supports an argument for careful product measurement, not automatic investment in every AI feature.
Mobile Development Technology and Framework Trends
React Native, Flutter and Native Development
RevenueCat's 2026 report provides subscription conversion statistics for apps grouped by their development framework.
Framework | Median download-to-paid conversion by day 35 |
|---|---|
React Native | 2.5% |
Native | 2.0% |
Flutter | 1.8% |
These figures describe applications within RevenueCat's measured sample.
They should not be treated as a controlled comparison of framework performance.
Different app categories, teams, audiences and subscription strategies may contribute to the observed differences.
The report also finds that median annual subscription retention was relatively close across development frameworks, ranging from 27.0% to 30.6% in the reported framework groups.
That provides a useful warning against selecting a framework based solely on monetization statistics.
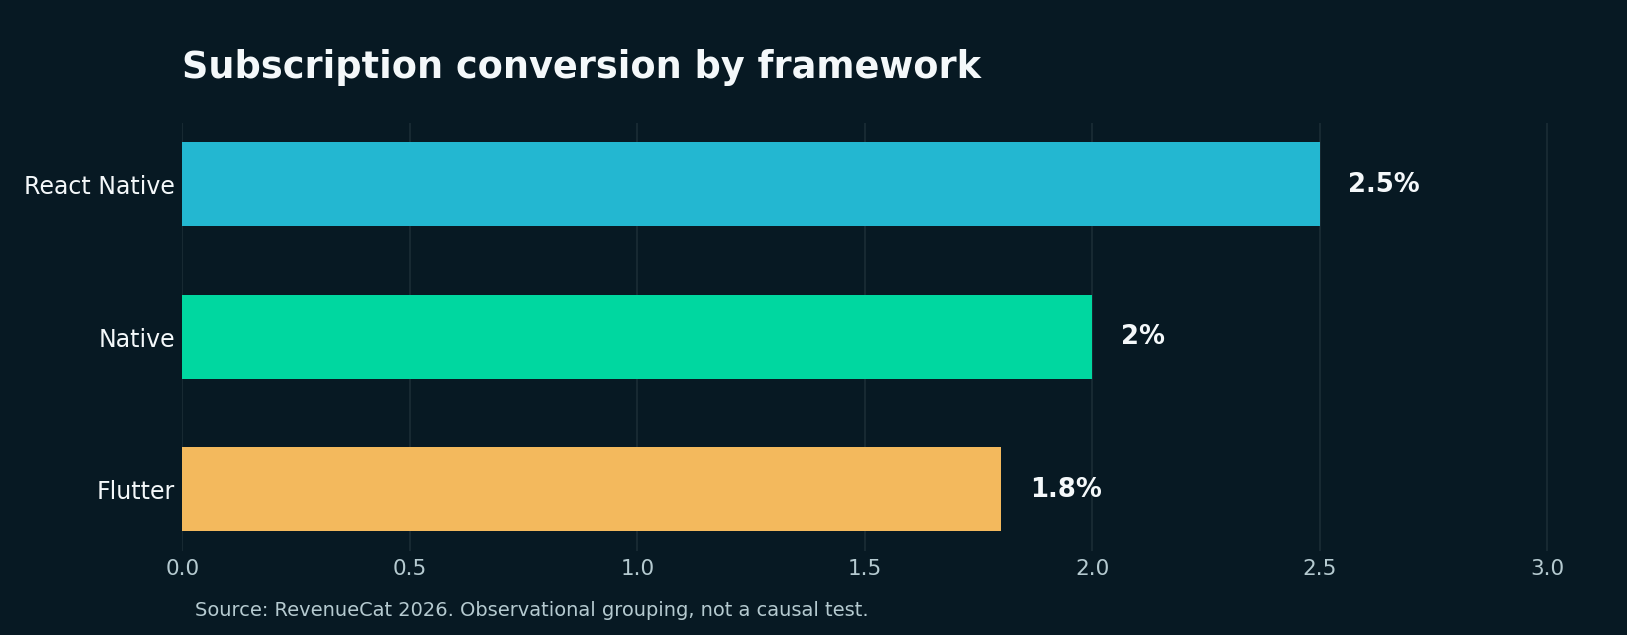
Figure 9. Median day-35 download-to-paid conversion by framework in the measured sample.
Native Versus Cross-Platform Considerations
Native development can provide direct access to platform-specific capabilities and integration patterns.
Cross-platform frameworks can allow teams to reuse parts of application code and workflows across operating systems.
Neither approach is automatically best for every business.
Teams should consider required device features, interaction complexity, accessibility, performance testing, release schedules, maintenance, and available engineering expertise.
A framework decision should begin with product requirements, not an unrelated statistic about language popularity.
Security and Reliability
Mobile products need more than functional screens.
Security considerations include authentication, secure local storage, API authorization, data handling and platform permissions.
Performance requirements may include responsiveness, crash monitoring, network resilience and accessibility.
The OWASP Mobile Application Security Verification Standard is one useful reference for defining mobile security requirements.
These engineering considerations are important even when market statistics do not provide a numerical benchmark for them.
Mobile App Statistics by Category and Geography
Category-Level Spending Trends
Sensor Tower reports that non-game applications surpassed games in in-app purchase spending during 2025 within its measured store coverage.
It reports non-game app spending growth of approximately 21% year over year.
Generative AI applications were among the important growth contributors.
However, an app category's revenue growth should not be interpreted as evidence that every business entering the category will succeed.
Competition, acquisition costs, retention, and differentiation can affect outcomes.
Regional Differences in Subscription Economics
RevenueCat's regional subscription data provides a useful comparison of developer-location groups.
For example, its median year-one realized lifetime value per payer was approximately:
Developer headquarters region | Median year-one realized lifetime value per payer |
|---|---|
North America | $32 |
Western Europe | $25 |
Global median | $23 |
India / Southeast Asia grouping | $14 |
These are grouped by developer headquarters, not necessarily the location of every paying customer.
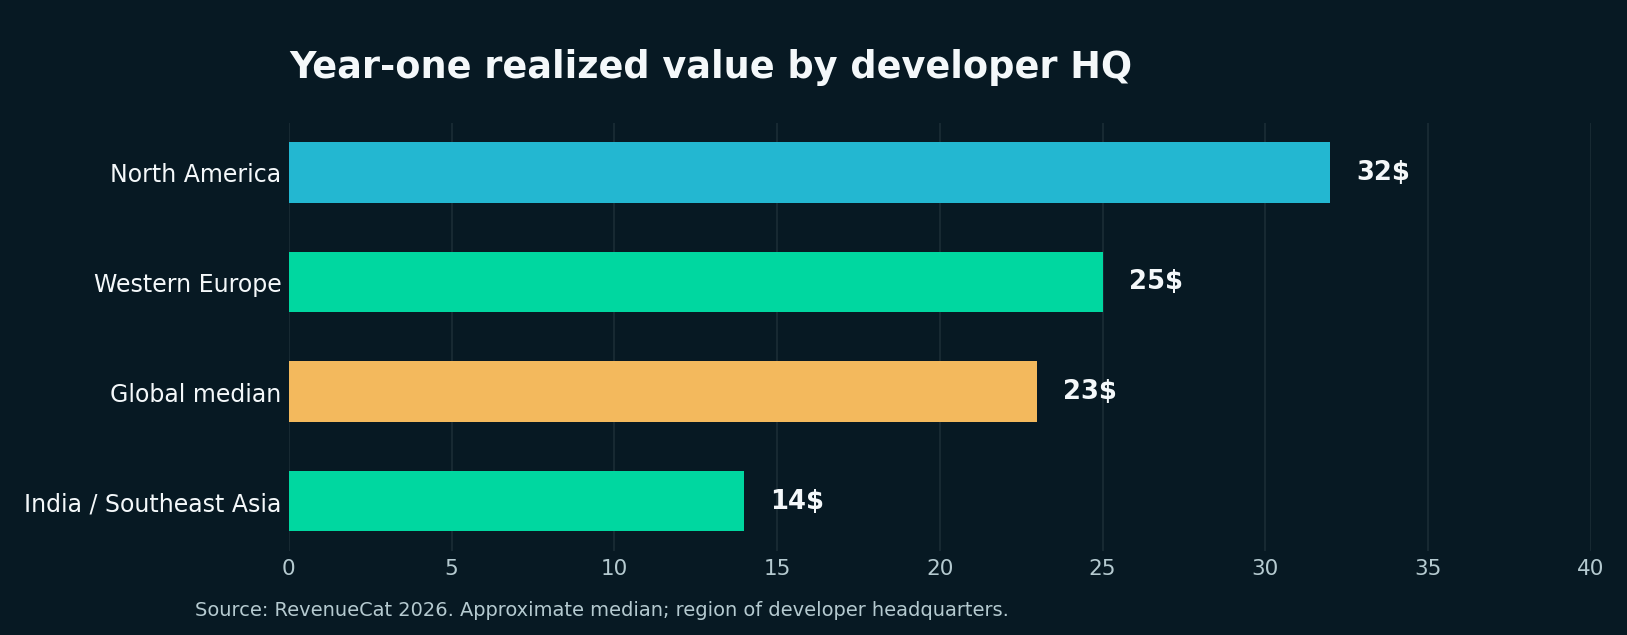
Figure 10. Developer-headquarters-based medians, not consumer-location spending statistics.
They should not be used as a direct comparison of national consumer spending.
The distinction matters for research. A company headquartered in one region may sell subscriptions to customers worldwide.
Interpreting Regional App Economics
A business targeting multiple countries should investigate:
- Relevant platform adoption and device mix.
- Local payment habits.
- Language and accessibility requirements.
- Subscription price sensitivity.
- Privacy and regulatory obligations.
- Connectivity, infrastructure and support expectations.
Regional averages can provide context, but product decisions should be based on the intended customer population.
What These Statistics Reveal About the Mobile App Industry
The findings support a practical decision framework.
Business decision | Relevant evidence | Appropriate interpretation |
|---|---|---|
Which platform first? | Statcounter and RevenueCat | Evaluate reach and monetization separately |
How large is the opportunity? | Market research and Sensor Tower | Use market definitions relevant to the product |
Which monetization model? | RevenueCat conversion and retention | Compare acquisition, conversion and long-term value |
Should AI be included? | AI revenue and retention findings | Validate recurring usefulness and operating cost |
Native or cross-platform? | Technical requirements and framework comparisons | Do not assume correlation proves framework superiority |
What budget is needed? | Project scope and transparent cost model | Estimate effort, rate, contingency and ongoing support |
What should be measured after launch? | Product analytics and subscription benchmarks | Track acquisition, activation, retention and revenue |
The central business lesson is that development decisions require more than a headline market-size statistic.
Application strategy must connect market opportunity with user needs, product requirements, operating costs, and measurable outcomes.
For companies moving from research into implementation, the mobile app development services page provides relevant service context.
Readers looking for broader industry background can also consult Software Development Statistics 2026.
Mobile App Industry Forecasts and Future Outlook
Market forecasts indicate substantial anticipated growth, but publishers disagree on market boundaries and projection assumptions.
Market Research Future projects the development market to reach approximately $988.5 billion by 2035.
Allied Market Research forecasts approximately $606.1 billion by 2032 under its development-market definition.
Fortune Business Insights forecasts a broader mobile application market of approximately $1.017 trillion by 2034.
These projections should not be connected into a single growth series.
They also do not predict revenue for a specific development agency, application, startup or investment.
The outlook for individual products will depend on factors such as customer demand, acquisition, monetization, retention, competitive positioning and execution quality.
Conclusion
The mobile app industry continues to expand, but its most important statistics tell different stories.
Downloads show distribution. Usage shows engagement. App-store spending measures particular consumer transactions. Market-research valuations use proprietary industry definitions. Subscription benchmarks reveal the difficulties of converting and retaining customers.
In Sensor Tower's 2025 figures, spending rose substantially faster than downloads.
RevenueCat's subscription data also shows that stronger early monetization does not guarantee long-term retention, especially for AI-powered products.
For businesses developing mobile applications, the most useful takeaway is not that the market is large. It is that product decisions should be grounded in customer needs, realistic development budgets, platform requirements and measurable business outcomes.
For researchers and journalists, the most important rule is simpler: always cite what the number measures, when it was measured, and who published it.
That is what makes mobile app development statistics credible and reusable.
Planning a Mobile App? Talk to Toadster Technologies
Industry statistics help identify opportunities, but a successful mobile product still needs the right platform strategy, development scope, security and long-term support. Toadster Technologies helps businesses plan and develop iOS, Android, cross-platform and AI-powered mobile applications.
Explore Toadster Technologies’ Mobile App Development Services